
STATISTICS
Mean
Calculating the Mean from a Set of Data, Frequency Distribution Tables and Histogram
Calculate the mean from a set of data, frequency distribution tables and histogram
Measures of central tendency:
After collecting the data, organizing it and illustrating it by means of diagrams, there is a need to calculate certain statistical measures to describe the data more precisely. There are various types of measures of central tendency – the arithmetic mean (or simply the mean), the median, and the mode. Once the measures of central tendency are found, it is easier to compare two or more sets of data.
The arithmetic mean
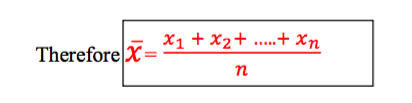
When people are asked to find the measure of central tendency of some numbers, they usually find the total of the numbers, and then divide this total by however many numbers there are. This type of measure of central tendency is the arithmetic mean. If the n values are x1+x2+x3 ………+xn then the arithmetic mean is = x1 + x2+ ….. + xn/n
Example 1
The masses of some parcels are 5kg, 8kg, 20kg and 15kg. Find the mean mass of the parcels.
Solution
Total mass = (5 + 8 + 20 + 15) kg = 48kg
The number of parcels = 4
The mean mass = 48kg ÷ 4 = 12kg
The arithmetic mean used as measure of central tendency can be misleading as can be seen in the following example.
Example 2
John
and Mussa played for the local cricket team. In the last six batting
innings, they scored the following number of runs.John: 64, 0, 1, 2, 4,
1;Mussa: 15, 20, 13, 11 , 10, 3.Find the mean score of each player.
Which player would you rather have in your team? Give a reason.
and Mussa played for the local cricket team. In the last six batting
innings, they scored the following number of runs.John: 64, 0, 1, 2, 4,
1;Mussa: 15, 20, 13, 11 , 10, 3.Find the mean score of each player.
Which player would you rather have in your team? Give a reason.
Solution
John’s mean = (64 + 0 + 1 + 2 + 4 + 1) ÷ 6 = 12
Mussa’s mean = (15 + 20 + 13 + 11 + 10 + 3) ÷ 6 = 12
Each
player has the same mean score. However, observing the individual
scores suggests that they are different types of player. If you are
looking for a steady reliable player, you would probably choose Mussa.
player has the same mean score. However, observing the individual
scores suggests that they are different types of player. If you are
looking for a steady reliable player, you would probably choose Mussa.
Often it is possible to use the mean of one set of numbers to find the mean of another set of related numbers.
Suppose a number a is added to or subtracted from all the data. Then a is added to or subtracted from the mean.
Suppose
the n values are 𝑥!+𝑥! + 𝑥! ………+𝑥!. Multiply each by a, and
we obtain 𝑎𝑥!+𝑎𝑥! + 𝑎𝑥! ………+𝑎𝑥!. So we see that the mean
has been multiplied by a.
the n values are 𝑥!+𝑥! + 𝑥! ………+𝑥!. Multiply each by a, and
we obtain 𝑎𝑥!+𝑎𝑥! + 𝑎𝑥! ………+𝑎𝑥!. So we see that the mean
has been multiplied by a.
Interpreting the Mean Obtained from a Set Data, Frequency Distribution Tables and Histogram
Interpret the mean obtained from a set data, frequency distribution tables and histogram
Measures of central tendency from frequency tables
If the data has already been put into a frequency table, the calculation of the measures of central tendency is slightly easier.
Exercise 1
Juma rolled a six- sided die 50 times. The scores he obtained are summarized in the following table.Calculate the mean score
| Score (x) | 1 | 2 | 3 | 4 | 5 | 6 |
| Frequency (f) | 8 | 10 | 7 | 5 | 12 | 8 |
Solution
10 scores of 2 give a total 10 x 2 = 20
8 scores of 1 gives a total 8 x 1 = 8
And so on, giving a total score of
8 x 1 +10 x 2+7 x 3 + 5 x 4 + 12 x 5 + 8 x 6 = 177
The total frequency = 8 + 10 + 7 + 5 + 12 + 8 = 50
The mean score = 177 ÷ 50 = 3.34
Medium
The Concept of Median
Explain the concept of median
Mr.Samwel
owns a small factory. He earns about 4,000,000/- from it each year. He
employs 4 people. They earn 550,000/-, 500,000/-, 450,000/- and 400,
000/-.The mean income of these five people is(4,000,000 + 550,000 +
500,000 + 450,000 + 400,000 ÷ 5 = 1,180,000/-
owns a small factory. He earns about 4,000,000/- from it each year. He
employs 4 people. They earn 550,000/-, 500,000/-, 450,000/- and 400,
000/-.The mean income of these five people is(4,000,000 + 550,000 +
500,000 + 450,000 + 400,000 ÷ 5 = 1,180,000/-
If
you said to one the employees that they earned about 1,180,000/- each
year they would disagree with you. In this type of situation when one of
the values is different from the others (as in Example 2), the mean is
not the best measure of central tendency to use.Arrange the incomes in
increasing order of size as follows:
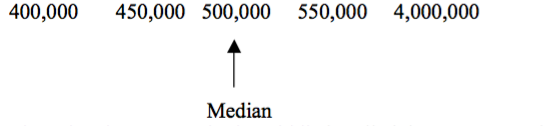
The
value that appears in the middle is called the median. In this case the
value of 500,000/- is a much better idea of the average wage earned by
the employees. The median is not affected by isolated values (sometimes
called rogue values) that are much larger or smaller than the rest of
the data.
value that appears in the middle is called the median. In this case the
value of 500,000/- is a much better idea of the average wage earned by
the employees. The median is not affected by isolated values (sometimes
called rogue values) that are much larger or smaller than the rest of
the data.
If the data consists of an even number of values, find the mean of two middle values as shown in the next example.
The Medium from a Set of Data
Calculate the medium from a set of data
Example 3
Find the median of the numbers: 12, 23, 10, 8, 22, 14, 30, and 18.
Solution
Arranging in increasing order of size, we get 8 10 12 14 18 22 23 30
Median = (14 + 18) ÷ = 16
The Median using Frequency Distribution Tables and Cumulative Curve
Find the median using frequency distribution tables and cumulative curve
Example 4
Juma rolled a six- sided die 50 times. The scores he obtained are summarized in the following table. Calculate the modianl score
Solution
here
are 50 items of data, so if you arrange them in order of size, the
positions are1 ……………….. 25 and 26 …………….. 50. The
median will be the average of the 25th and 26th number.
are 50 items of data, so if you arrange them in order of size, the
positions are1 ……………….. 25 and 26 …………….. 50. The
median will be the average of the 25th and 26th number.
In
the table there are 8 scores of 1, followed by 10 scores of 2. This
gives you 8 + 10 = 18 numbers. These are then followed by 7 scores of 3.
This gives 18 + 7 = 25 numbers. It follows that the 25th number is a 3.
The 26th number must be the first number in the next group, which is a
4.
the table there are 8 scores of 1, followed by 10 scores of 2. This
gives you 8 + 10 = 18 numbers. These are then followed by 7 scores of 3.
This gives 18 + 7 = 25 numbers. It follows that the 25th number is a 3.
The 26th number must be the first number in the next group, which is a
4.
The median is then = (3 + 4) ÷ 2 = 3.5
The Median Obtained from the Data
Interpret the median obtained from the data
Exercise 2
- The
times of five athletes in the 100 m were: 12.5 s, 12.9s, 14.8s, 15.0s,
25.2s. Find the median time. Why is the median a better measure of
central tendency to use than the mean? - Iddi has 6 maths tests
during a school term. His marks are recorded below. Find the mean and
the median mark. Explain why the median is a better measure of central
tendency than the mean 73 78 82 0 75 86 - The table below gives
the percentage prevalence of HIV infection in female blood donors for
the years 1992 to 2003. Find the mean and median of these figures.
| 1992 | 1993 | 1994 | 1995 | 1996 | 1997 | 1998 | 1999 | 2000 | 2001 | 2002 | 2003 |
| 5.9 | 6.2 | 4.8 | 9.4 | 8.2 | 11.6 | 11.8 | 12.6 | 13.3 | 13.7 | 12.3 | 11.9 |
Mode
The Concept of Mode
Explain the concept of mode
The
mode is value that occurs most often in a set of data.This is another
measure of central tendency. It is possible for data to have more than
one mode.
mode is value that occurs most often in a set of data.This is another
measure of central tendency. It is possible for data to have more than
one mode.
Data with two modes are said to be bi – modal.Why mode? The mode is often important to know. For example:
- If you ran a shoe shop you would want to know the most popular size.
- If you ran a restaurant you would want to know what type of food is ordered most.
The Mode
Calculate the mode
Example 5
State the mode for the following sets of numbers:
- 0, 0, 1, 1, 1, 2, 2, 3, 4, 5, 5
- 58, 57, 60, 59, 50, 56, 62
- 5, 10, 10, 10, 15, 15, 20, 20, 20, 25
Solution
- 1 occurs most (3 times): The mode is 1
- All the numbers appear once: There is no mode.
- There are three 10s and three 20s: Modes are 10 and 20.
Exercise 3
- Ten
pupils were asked how many brothers or sisters they had. The results
are recorded below. Find the mode number 0, 1 , 1, 2, 5, 0, 1 3 , 1 and
4. - Eight motorists were asked how many times they had taken the
driving test before they passed. The results are recorded below. Find
the mode number. 14213141 - Give examples of where the mode is a better measure of central tendency than either the mean or the median.
- Find the mode of these sets of numbers.
- 0, 1, 1, 3, 4, 5, 5, 5, 6, 7, 8
- 3, 8, 4, 3, 8, 4, 3, 8, 8, 3, 3, 4
- 5, 12, 6, 5, 11, 12, 5, 5, 8, 12, 7, 12
- 3, 6, 2, 8, 2, 1, 9, 12, 15
Finding the Mode using Frequency Distribution and a Histogram
Find the mode using frequency distribution and a histogram
Grouped data
Suppose
a set of data consists of many different values, such as heights of
people measured to the nearest centimeter. Then the data is grouped, for
example into 160 – 165 cm, and so on. If the data has been grouped
together in classes, then unless you have a list of all the individual
values, you only know approximately what each value is. For this reason,
you can only estimate the mean and the median. Also, if all the values
are different, you do not have a single value as the mode. Instead you
have a modal class, as shown in the example below.
Data
grouped in classes can be illustrated by a histogram.Suppose one of the
intervals is from 10 to 19, where data has been rounded to the nearest
whole number. The class limits are 10 and 19. The data in this interval
could be as low as 9.5 or as high as 19.5. These are the class
boundaries. The width of the interval is the difference between the
class boundaries, in this case it is 10.
The
histogram consists of rectangles between the class boundaries, with
height corresponding to the frequency. The area of each rectangle is
proportional to the frequency.
histogram consists of rectangles between the class boundaries, with
height corresponding to the frequency. The area of each rectangle is
proportional to the frequency.
Example 6
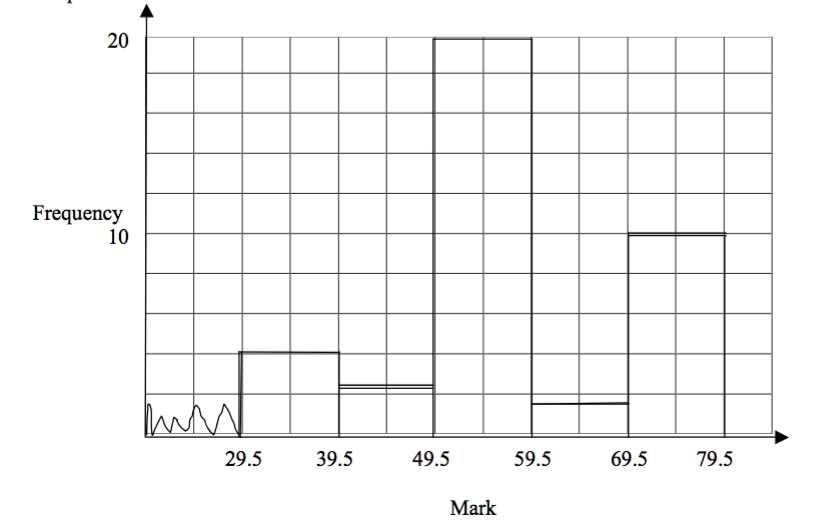
The examination results (rounded to the nearest whole number %) are given for a group of students.
| Mark (%) | 30 – 39 | 40 -49 | 50 – 59 | 60 – 69 | 70 – 79 |
| Frequency | 5 | 3 | 20 | 2 | 10 |
- Draw a histogram
- state the modal class
Solution
For
a histogram, the horizontal axis is for the data values, and the
vertical axis is for the frequencies. So label the horizontal axis with
the marks from 30 to 80. To indicate that the axis does not start at 0
put a zig – zag to the left of 30. Label the vertical axis with
frequencies from 0 to 20. The first interval has limits 30 and 39. The
class boundaries are 29.5 and 39.5. It has a frequency of 5. So draw a
box covering the interval, and with height 5. Repeat with the other
intervals
Interpreting the Mode Obtained from the Data
Interpret the mode obtained from the data
Example 7
The examination results (rounded to the nearest whole number %) are given for a group of students.
| Mark (%) | 30 – 39 | 40 -49 | 50 – 59 | 60 – 69 | 70 – 79 |
| Frequency | 5 | 3 | 20 | 2 | 10 |
Estimate the mode
Solution
To estimate the mode, there are two methods.
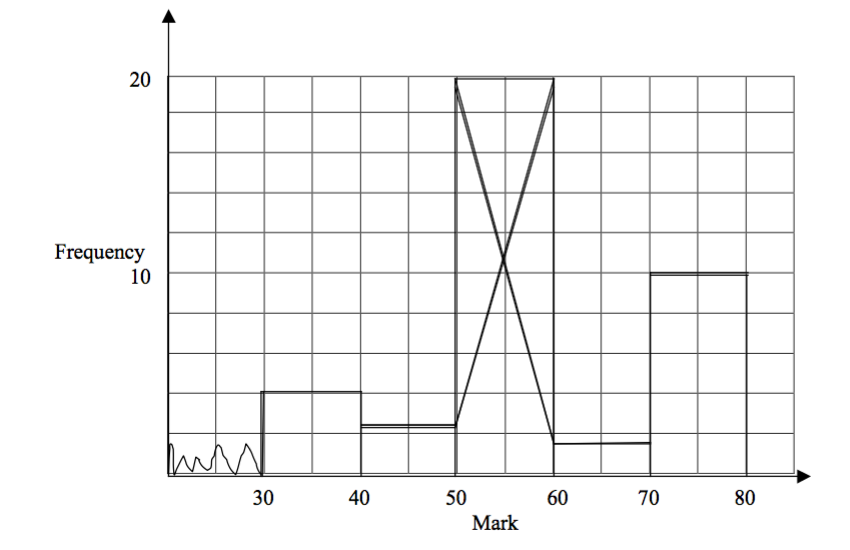
By drawing:Use the histogram of the first part.Then proceed as follow;
- Step
1: Draw a straight line from the top left hand corner of the rectangle
of the modal class, to the top left hand corner of the rectangle of the
class to the right of the modal class. - Step 2: Draw a line from
the top right hand corner of the rectangle of the modal class,to the top
right of the modal class to the left of the modal class. - Step 3: Find where these two lines intersect. This gives the mode as 54 on the horizontal axis.
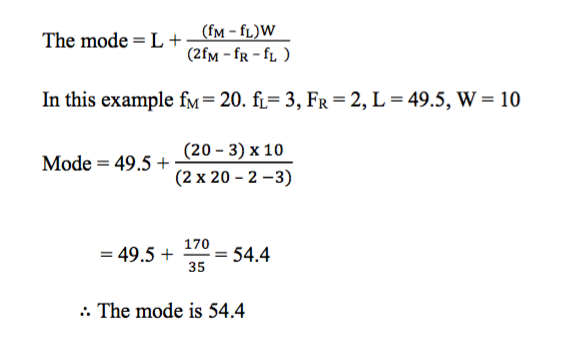
By calculation:Let
- fM = frequency of the modal group
- fR = frequency of the group to the right of the modal group
- fL = frequency of the group to the left of the modal group
- W = width of the modal group
- L = lower class boundary of the modal group


Wonderful blog you have here but I was curious about if you knew of any community forums
that cover the same topics discussed here? I’d really like to be a part
of community where I can get responses from other experienced individuals that share the same
interest. If you have any recommendations, please let me know.
Many thanks!
If you are going for most excellent contents like I do, only go to
see this web page everyday since it gives feature contents, thanks
Greetings! This is my first visit to your blog! We are a group of volunteers and
starting a new project in a community in the same niche.
Your blog provided us valuable information to work on. You have
done a extraordinary job!
I’d like to find out more? I’d love to find out some additional information.
Hi there just wanted to give you a quick heads up.
The words in your content seem to be running off the screen in Ie.
I’m not sure if this is a format issue or something to do with browser compatibility but I figured I’d post to let you know.
The layout look great though! Hope you get the issue resolved soon. Thanks
My page – download game ace333
Have you ever considered publishing an e-book or guest authoring on other
sites? I have a blog based on the same subjects you discuss and would love to
have you share some stories/information. I know my readers would value your
work. If you are even remotely interested, feel free to send me an e-mail.
Here is my homepage – ace333 download ios – 918kiss-m.com –
My brother recommended I might like this website.
He was entirely right. This post truly made my day.
You can not imagine simply how much time I had spent for this info!
Thanks!
my web-site: download game 918kiss 2
Hello my loved one! I wish to say that this article is amazing, great written and come with almost
all vital infos. I would like to peer more posts like this .
my website; kiosk Ok388 (918kiss-m.Com)
This is really interesting, You’re a very skilled blogger.
I have joined your feed and look forward to seeking more of your wonderful post.
Also, I have shared your site in my social networks!
my blog lpe88apk download
What i don’t understood is in truth how you’re
not really a lot more smartly-favored than you might be now.
You are very intelligent. You know thus significantly relating to this topic, produced me personally consider it from numerous varied angles.
Its like women and men are not fascinated unless it is one thing to
do with Lady gaga! Your individual stuffs great. Always handle it up!
Hi, after reading this remarkable piece of writing i am too glad to share my familiarity here with
friends.
Fastidious answers in return of this difficulty
with real arguments and telling the whole thing concerning that.
Howdy just wanted to give you a quick heads up and let you know a few of the pictures aren’t loading
properly. I’m not sure why but I think its a linking issue.
I’ve tried it in two different browsers and both show the same outcome.
Look into my webpage: game mega888 online (918kiss-m.com)
Your style is so unique compared to other people I have read stuff from.
I appreciate you for posting when you have the
opportunity, Guess I will just book mark this site.
Look into my webpage gem Wukong333 (https://918kiss-m.Com)
Hello every one, here every one is sharing these knowledge,
so it’s pleasant to read this webpage, and I used to pay a visit this website every day.
Here is my blog post akaun test ntc33
Hello, i think that i noticed you visited my site thus
i came to go back the choose?.I’m trying to find things to improve my site!I assume its ok to make use of a few
of your concepts!!
My webpage :: judi online indonesia (Blaine)
Im thankful for the post.Really thank you! Want more.
Every weekend i used to go to see this website, as i wish for enjoyment, since this this web site conations truly
pleasant funny information too.